Projects / 2024-2026
Scientific imaging workflows
A project developing desktop applications for STM, EC-STM and LEED data analysis: from curation, registration, detection and tracking to validated metrics and result export.
Short Project Description
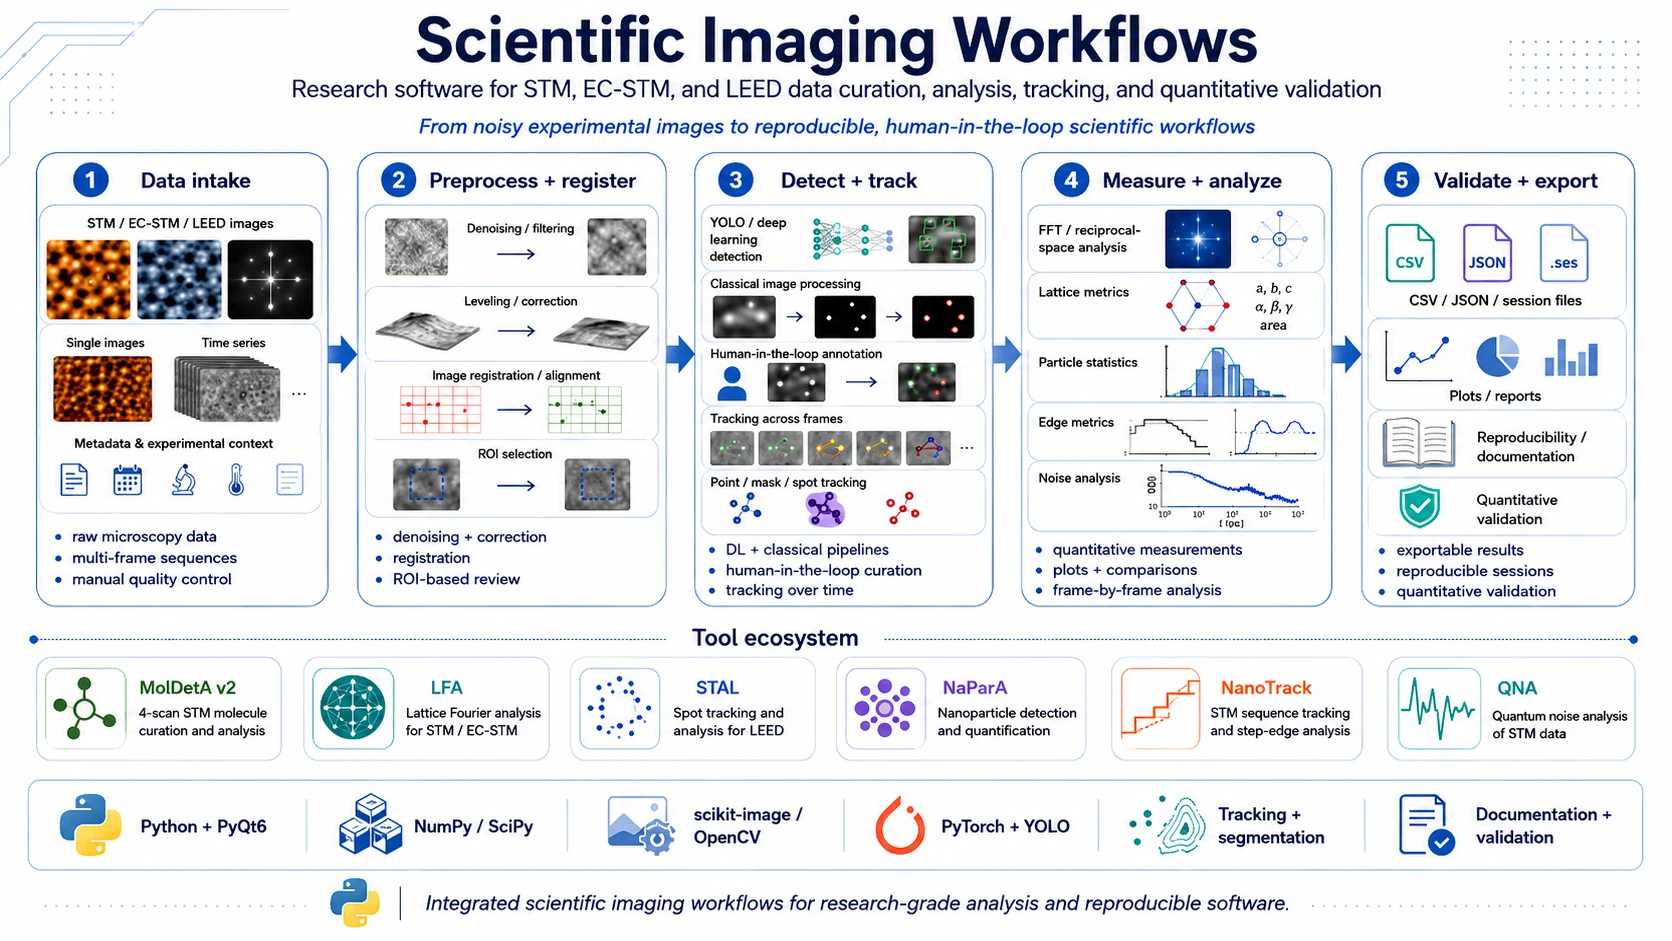
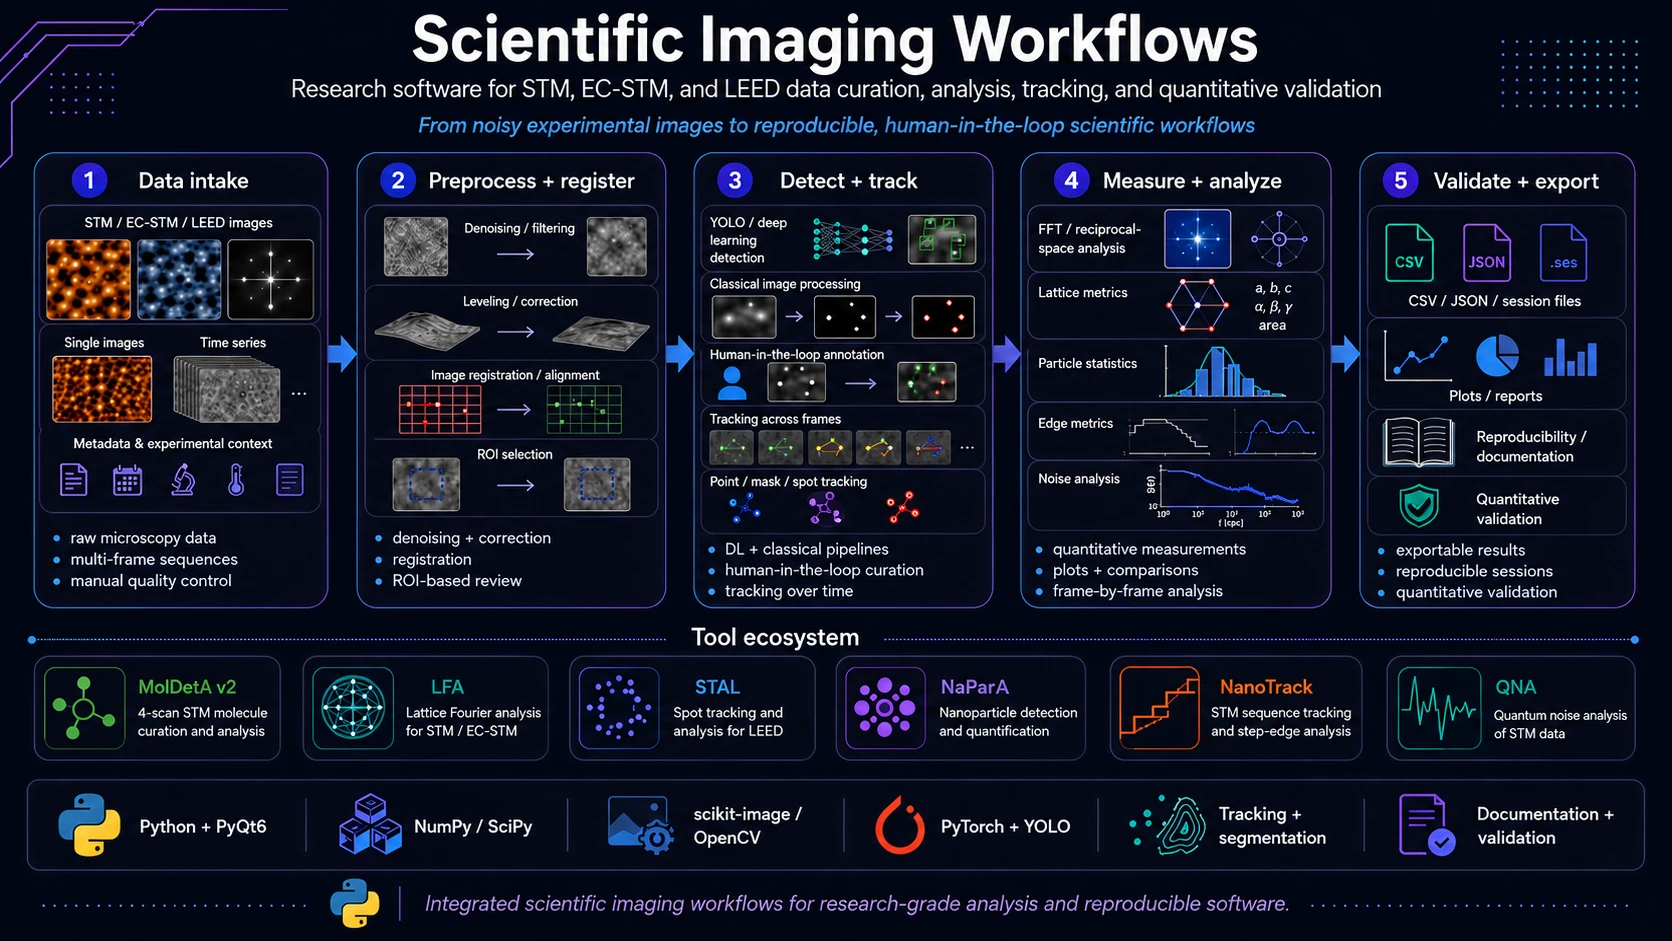
Scientific imaging workflows is an umbrella software project focused on practical analysis of difficult experimental data from microscopy and surface diffraction. It covers applications for STM/EC-STM images, STM/MPP sequences and LEED images where automation, manual quality control, quantitative validation and result export are needed at the same time.
The shared design principle is human-in-the-loop work: an algorithm can detect, fit, propagate or track objects, but the user can still inspect the result, correct geometry, lock accepted objects, compare variants and export data in an explicit, reviewable form.
The project includes tools such as MolDetA v2, Lattice Fourier Analyzer (LFA), Spot Tracking & Analysis for LEED (STAL), NaParA, NanoTrack and Quantum Noise Analysis (QNA).
Problem
STM, EC-STM and LEED data are often difficult to analyze automatically. Typical problems include:
- image drift, scanner distortions and imperfect frame alignment,
- noisy or heterogeneous microscopy images,
- sequence analysis rather than only single-frame analysis,
- comparing multiple channels, scan directions or experimental states,
- limited trust in automatic detection in dense scenes,
- exporting results for publications, validation, notebooks and downstream modeling.
For that reason, the tools are not just detectors. They are complete applications for experimental-data curation, where automation and manual inspection work together.
Main Workflow Idea
A typical workflow in this project looks like this:
- Experimental data import - STM/EC-STM/LEED images and sequences with metadata, physical scale and frame information.
- Inspection and preprocessing - image preview, ROI work, denoising, line correction, leveling, filtering and algorithm preparation.
- Registration and mapping - frame alignment, optical flow, phase correlation, ECC, affine transforms or displacement maps.
- Detection or seeding - YOLO, classical image processing, ROI, bbox, segmentation, contours or manual seeds.
- Tracking and curation - point, mask, LEED-spot, particle, step-edge or molecule tracking with manual correction.
- Quantitative analysis - geometry, intensity, radii, distances, lattice parameters, distributions and potential- or time-dependent functions.
- Validation and export - sessions, CSV/JSON/NPZ/STP, plots, comparison tables, training files and technical reports.
Stack and Architecture
The project is primarily built around Python / PyQt6. I use pyqtgraph for interactive visualization, Matplotlib for summary plots and NumPy, SciPy, pandas, scikit-image and OpenCV for numerical and image-processing workflows.
Selected workflows also use PyTorch, Ultralytics YOLO, SAM2-family backends, point trackers and edge detectors. Heavier models are run through subprocesses in separate Python/conda environments so that the main PyQt6 application can remain stable despite conflicting dependencies.
Key architecture patterns:
- human-in-the-loop - automation proposes results and the user verifies them,
- original-data-first - the user can still inspect the original experimental data,
- reproducible sessions - sessions store input data, parameters, objects, corrections and results,
- quantitative validation - applications generate quality metrics, residuals, fit quality, registration QA or frame-by-frame comparisons.
Related Applications
MolDetA v2
Molecule Detection, Annotation and Analysis is a PyQt6 application for molecule curation in four synchronized STM scans: fwd_topo, bwd_topo, fwd_current, bwd_current. The program shows original images and uses registration as an internal layer for bbox mapping and analysis.
Key elements: YOLO and classical detection, bbox propagation between scans, manual editing, four-role grouping, categories, filters, molecule-list workspace, intensity analysis and line-wise acquisition analysis.
Lattice Fourier Analyzer (LFA)
LFA is a tool for analyzing crystal lattices and superstructures in STM/EC-STM images. It uses FFT, Bragg peak localization and substrate-anchored affine correction to measure lattice parameters, adsorbate-substrate registry and superstructure metrics.
Key elements: STM preprocessing, ROI FFT, 2D Gaussian fitting, affine drift correction, real-space lattice parameters, adsorbate lattice analysis and CSV/JSON export.
Spot Tracking & Analysis for LEED (STAL)
STAL is an application for detecting, tracking and analyzing LEED diffraction spots in image sequences. It combines classical image processing, YOLO, linking methods and optical flow with 2D Gaussian fitting and metric export.
Key elements: spot detection, YOLO checkpoints, Hungarian linking, directional linking, optical flow, pattern center, radii, result tables, plots, CSV export and sessions.
NaParA
Nanoparticle Analyzer is an application for STM image preprocessing, nanoparticle detection and quantitative object-population analysis. It works with single images and image series, supporting ROI-based analysis and result export.
Key elements: .stp, .s94, .mpp import, ROI preview, Gaussian/Median/White top-hat, Otsu/Sauvola, contours, connected objects, centroids, areas, nearest-neighbor distance and CSV/PNG export.
NanoTrack
NanoTrack is a tool for STM sequences and MPP movies. It supports frame registration, object seeding, particle tracking, mask tracking and step-edge tracking, with results analyzed in original frame coordinates.
Key elements: sequence viewer, BM3D, horizontal repair, Phase/ECC/Optical Flow/Deep Matcher registration, YOLO seeds, SAM2/DAM4SAM/SAMURAI, TAPIR/LocoTrack/Track-On-R, edge backends, particle metrics, edge metrics and registration QA.
Quantum Noise Analysis (QNA)
QNA is an application for quantitative noise analysis in STM data. It lets the user define Site/Set ROI pairs, compute (I - I_SET)^2 maps, analyze metrics as a function of frame or potential and compare multiple sites in a sequence.
Key elements: .mpp, .stp, .s94 import, up to 25 ROI pairs, L0, L, K, I_A, D, A_site, A_set, E, Property vs frame, L0(E)/L(E) plots and STP map export.
Example Use Cases
Dense STM Image Curation
MolDetA v2 and NaParA support detecting, correcting and grouping objects in STM images where automatic detection has to be followed by manual quality control.
Sequence and Dynamics Analysis
NanoTrack and STAL are used to track time-dependent changes: particle motion, LEED spots, step edges or signal geometry across frames.
Registration and Mapping Validation
MolDetA v2, NanoTrack and LFA use different registration strategies to control drift, shifts and distortions between images or inside one frame.
Deep Learning as Experimental Assistance
YOLO, SAM2, point trackers and edge detectors are used as support tools rather than closed black boxes. They generate proposals that can be edited and validated.
Quantitative Analysis for Publications
LFA, QNA, STAL, NanoTrack and MolDetA v2 generate metrics, tables and exports that can be used for figures, comparisons, reports or supplementary materials.
My Contribution
Within the project I work across the full chain from workflow concept to tool implementation:
- designing application and analysis-module architecture,
- building PyQt6 interfaces and interactive viewers,
- integrating classical algorithms, deep learning and tracking,
- preparing session formats, exports and validation paths,
- organizing feature status in implementation plans,
- writing technical descriptions and documentation,
- testing tools on real STM/EC-STM/LEED data.
Project Status
The project is actively developed. Individual applications are at different maturity levels: some operate as working tools for current analysis, some are testbeds for new trackers and some implement specialized workflows for specific experimental data.
The main shared development direction is moving from one-off scripts toward reproducible research applications where the user can inspect data, algorithmic decisions, analysis parameters and final exports in one coherent environment.