Software / 2026
Lattice Fourier Analyzer (LFA)
Open-source Python desktop software for quantitative STM and EC-STM image analysis: preprocessing, FFT, drift correction, lattice metrology, uncertainty propagation and result export.
Overview
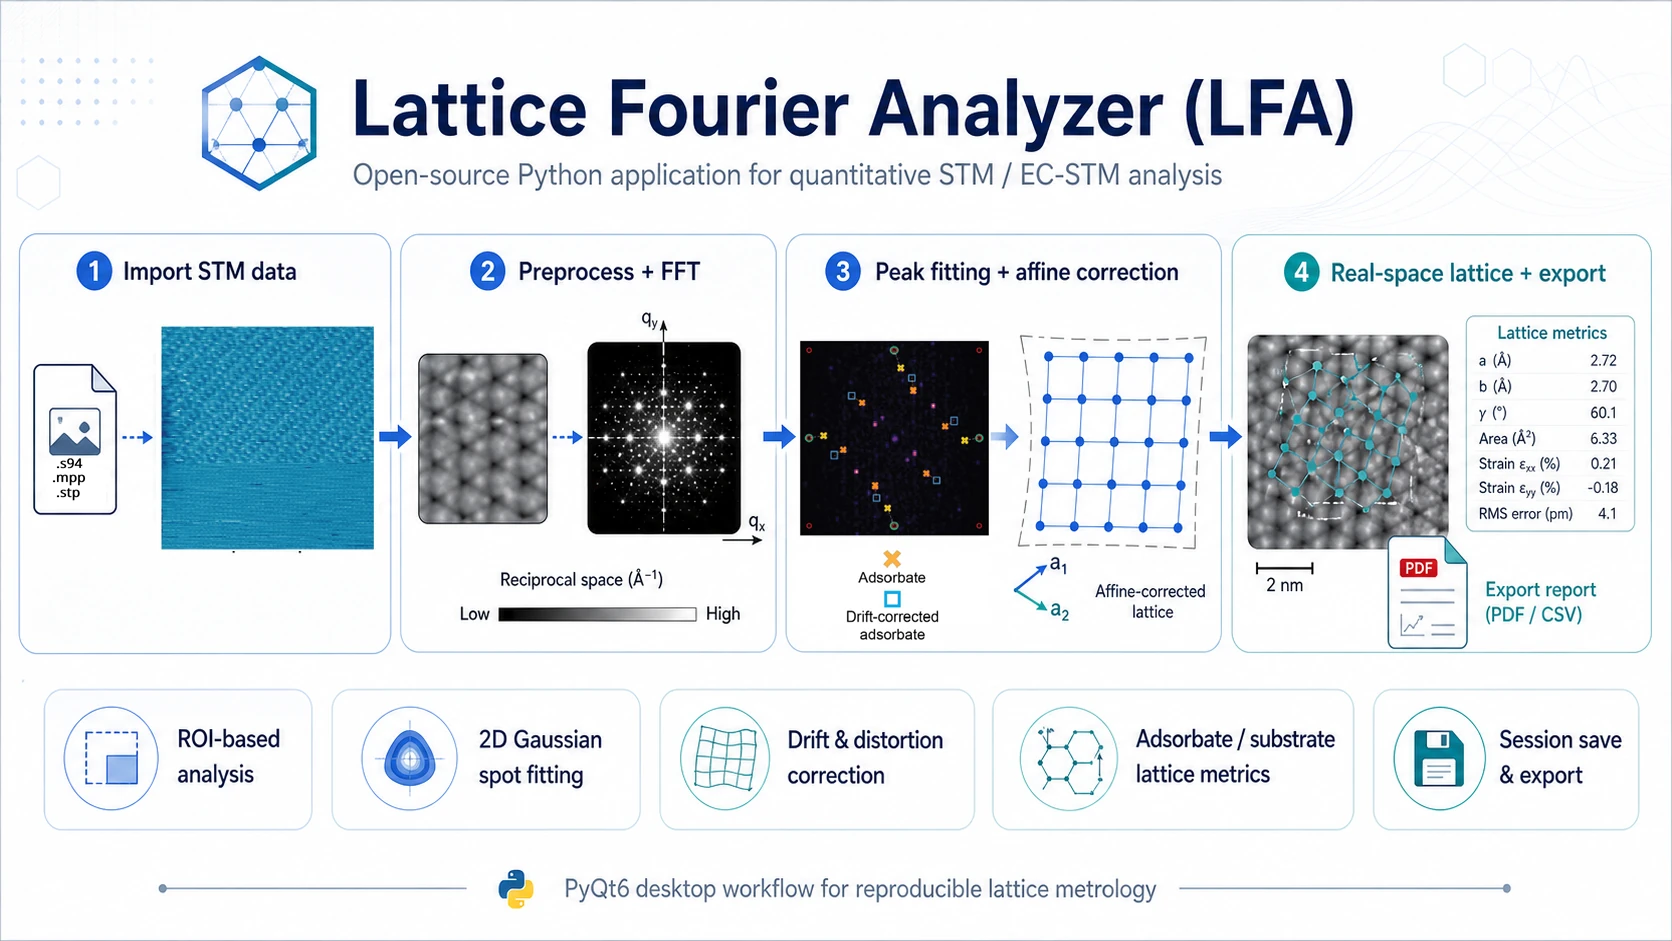
Lattice Fourier Analyzer (LFA) is an open-source Python desktop application for quantitative STM and EC-STM image analysis. It guides the user from raw topographic data through preprocessing and FFT analysis to lattice parameters, drift correction and real-space visualization.
LFA is designed for images that contain multiple periodicities at the same time, for example substrate, adsorbate and superstructure signals, where direct real-space measurement is affected by drift, scanner anisotropy or piezo distortion. The core idea is to use a known substrate lattice or a commensurate reference layer as an internal geometric standard.
What LFA Does
LFA combines STM image processing, Fourier analysis and lattice metrology in one workflow:
- imports STM images with calibration metadata,
- provides non-destructive image preprocessing,
- computes 2D FFT for full images or selected ROIs,
- supports precise Bragg-peak and satellite-peak localization,
- estimates affine correction for drift, rotation, scale and shear,
- computes substrate and adsorbate lattice parameters,
- analyzes superstructure periodicities from satellite peaks,
- reconstructs real-space images from masked FFT components,
- saves the full analysis workflow and exports tabular results.
Main Features
Data Import and Inspection
The software currently supports .stp and .s94 STM files. During import, LFA preserves image data and available metadata, such as scan size, pixel count, bias voltage, tunneling current, scan angle and calibration parameters. This enables a controlled transition from pixels to physical units such as nm and nm^-1.
STM Preprocessing
Preprocessing is optional and non-destructive. Each operation creates a new history state while the original image remains available. Supported tools include plane leveling, Gaussian filtering, unsharp mask, median filtering, Non-Local Means and BM3D when the optional bm3d package is installed.
FFT Analysis and Peak Localization
LFA computes two-dimensional Fourier transforms for full images or selected ROIs. The user can apply window functions such as Hann, Hamming and Blackman and choose the FFT display mode. Bragg and satellite peaks can be localized with sub-pixel precision using direct selection, pixel maxima, 2D Gaussian fitting, 3x3 parabolic interpolation or local DFT refinement.
Drift and Distortion Correction
The key feature of LFA is substrate-anchored affine correction. The user selects substrate peaks in the FFT map and the software fits them to an ideal reference lattice. This produces an affine transform describing image rotation, anisotropic scaling, shear, principal stretches and fit quality, including RMSE.
The correction is performed in reciprocal space, where lattice peaks can be localized precisely, and then transferred back to real space. This produces corrected lattice vectors, distances, angles and uncertainty estimates.
Adsorbate and Superstructure Analysis
After substrate correction is established, LFA can apply the same transform to adsorbate peaks. This means adsorbate-layer parameters are computed in the substrate reference frame rather than in the distorted STM image frame.
The software supports multiple adsorbate peak sets in one session, which is useful for rotated domains, coexisting phases and structures with different symmetries. For superstructures, LFA measures the splitting between a main peak and a satellite peak, then estimates modulation periods and relative modulation intensity.
Visualization, Sessions and Export
LFA supports corrected real-space lattice-vector visualization, substrate and adsorbate overlays, Patterson maps, FFT-masked reconstructions and an optional interactive 3D view when pyvista and pyvistaqt are available.
.lfa_proj sessions store controller state, history, selected peaks, analysis results, uncertainty metadata and visualization settings. Results can be exported to JSON, CSV or copied to the clipboard as a summary.
Typical Workflow
- Import
.stpor.s94data. - Inspect the image, metadata, scan size and calibration.
- Optionally apply leveling, filtering or denoising.
- Compute FFT for the full image or ROI.
- Analyze substrate peaks and estimate affine correction.
- Analyze adsorbate peaks in the substrate-corrected frame.
- Analyze superstructures, satellite peaks and modulation periods.
- Visualize real-space vectors, angles, domains and overlays.
- Export results and save the session.
Example Use Cases
- drift correction in STM / EC-STM images,
- adsorbate-substrate registration,
- potential-dependent structural analysis,
- molecular monolayers and supramolecular systems,
- multiple domains and phases in one experiment,
- preparation of tables, figures and supporting data for publications.
AtomMapper
The repository also includes AtomMapper, a separate desktop tool for local real-space STM analysis at the level of individual atoms and atomic rows. AtomMapper does not replace the FFT-based LFA workflow; it complements it when the user needs local point picking and row-level geometry analysis.
AtomMapper supports atom or local-maximum localization, small-ROI workflows, local peak fitting, row grouping, manual point correction, row-geometry analysis, local-disturbance candidates and point export to CSV.
LFA vs. AtomMapper
| Task | Recommended tool |
|---|---|
| FFT-based drift and scanner-distortion correction | LFA |
| Substrate and adsorbate lattice parameters | LFA |
| Adsorbate-substrate registration | LFA |
| Superstructure and satellite-peak analysis | LFA |
| Masked FFT reconstruction and Patterson maps | LFA |
| Individual atom localization in real space | AtomMapper |
| Atomic rows, distances and local deviations | AtomMapper |
| Manual point correction and atom-position export | AtomMapper |
Installation and Launching
Python 3.10 or newer is required. Python 3.12 is recommended for compatibility with the current development setup.
pip install -r requirements-core.txt
pip install -r requirements-optional.txt
Launch LFA:
python -m lfa.mainLaunch AtomMapper:
python -m AtomMapper.app.mainScope and Limitations
LFA works best for images where periodicities produce separated peaks in reciprocal space. Result quality depends on signal-to-noise ratio, peak separation, correct scan-size calibration and appropriate reference-peak selection.
Stable substrate correction usually requires at least four well-separated peaks for a square lattice and six for a hexagonal lattice. Superstructure analysis requires recognizable satellite peaks. If peaks overlap strongly or the image lacks reliable periodicity, the result requires careful user control.
AtomMapper is an interactive support tool. Point-localization results and local-disturbance candidates should be treated as quantitative assistance, not as automatic physical interpretation of the sample.
Publications, Data and Citation
- Publication describing LFA: LFA: A Lattice Fourier Analyzer for Quantitative In Situ EC-STM of Adsorbate-Substrate Superstructures.
- Project repository: github.com/RafLew84/NEtCAT_LFA.
- Data described in the paper: OSF DOI 10.17605/OSF.IO/K7A3N.
- Citation search: Google Scholar query.
If you use LFA in scientific work, cite the software/method paper and report the version or repository commit used for the analysis.
Rafał Lewandków, Paulina Wira, Anna Futyma, Radosław Wasielewski, Tomasz Kosmala, LFA: A Lattice Fourier Analyzer for Quantitative In Situ EC-STM of Adsorbate-Substrate Superstructures, Advanced Materials Interfaces, 2026, e70500. DOI:
10.1002/admi.70500.